Building graphs
Table of contents
- Class (or interface) dependencies
- Class (interface) extend and implementation dependencies
- Function or method dependencies
- Links within a class (or graph for the LCOM 4 metric)
- Links between files
- Namespace dependencies graph
- Namespace structure graph
- Function reachability
PhpStats allows you to create various graphs that display certain relationships in the code.
There are two ways to output, directly to svg and in the browser. The first option (default) is perfect if you need to save and send the graph to someone, the second (see flag --web) is ideal for immediate viewing. When displayed in a browser, the resulting graph can be moved, as well as its scale, using the mouse wheel. To try it, download one of the graphs below and open it in a separate browser tab (unfortunately, if you open the graph from github, then nothing will work, since github prohibits the use of internal scripts, which are necessary for interactive work).
To build graphs PhpStats uses Graphviz.
To create a graph in the internal interactive shell, use the graph command, which accepts another command that determines the type of the graph. Description and examples of commands below.
Class (or interface) dependencies
Example (svg): 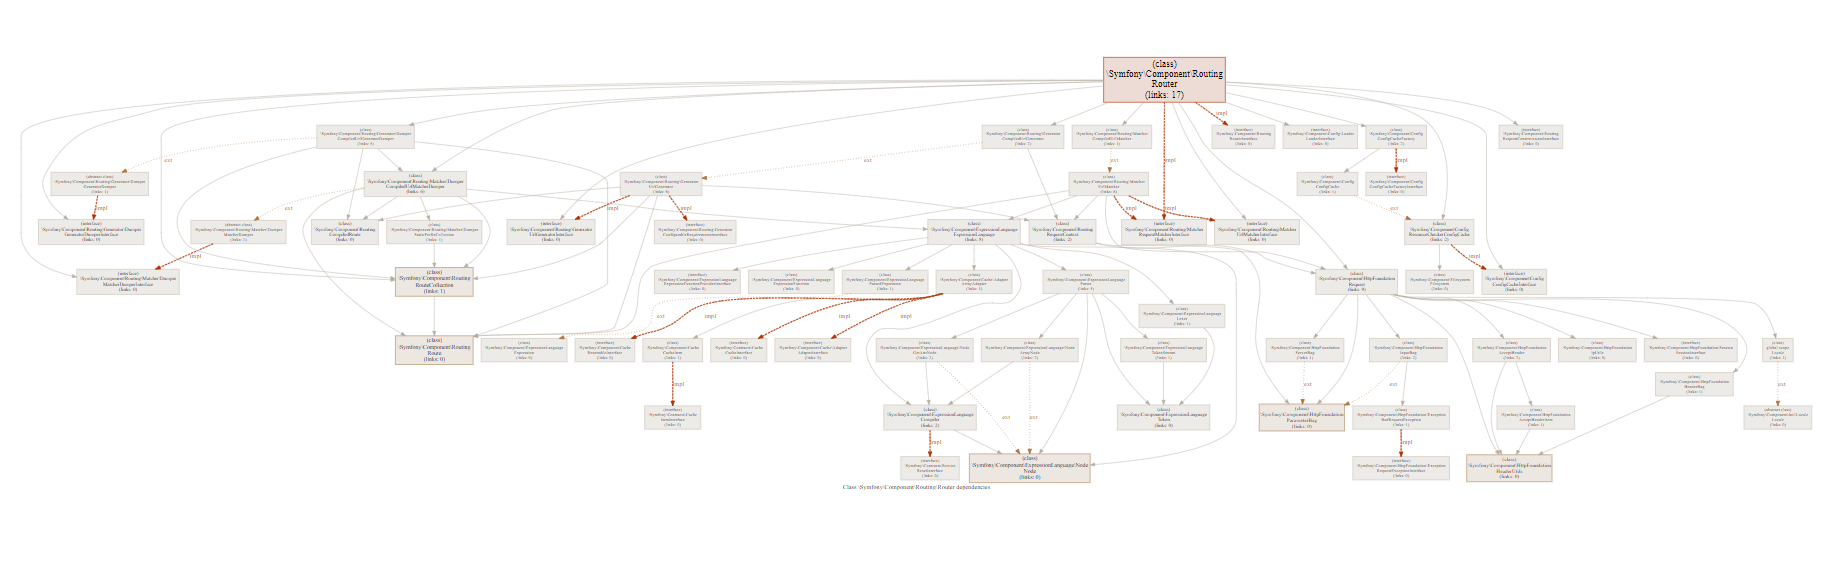
Includes the usual relationships between classes, as well as separate extend and implementation relationships. 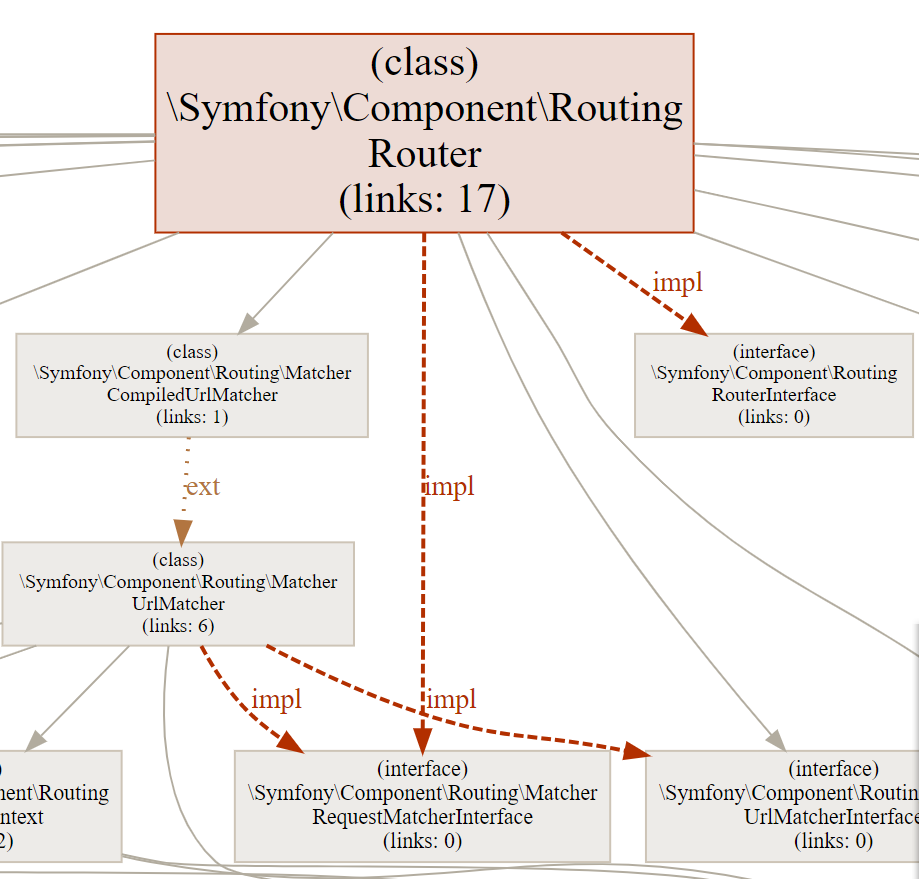
To build a graph, use the graph class command.
The command takes one argument, the name of the class.
The command can also accept flags:
-o— name of the file to which the graph will be saved;-r— the level of nesting that is required (value 0 displays only the closest dependencies, 1 — also displays all the closest dependencies for the closest dependencies, and so on);--inheritance— flag, when set, the graph will be displayed only with extends or implementation links, see the graph below;--web— flag, when set, the graph will be displayed in the browser with the ability to move and scale the graph.
Examples
For example, to create the graph above, the following command was used:
graph class -o graph.svg \Symfony\Component\Routing\Router
And for the graph below:
graph class -o graph.svg --inheritance \Symfony\Component\Routing\Router
Class (interface) extend and implementation dependencies
Example (svg): 
Contains only extend and implementation links.
To get the graph, use the same command as for the graph above. See the last example.
Function or method dependencies
Example (svg): 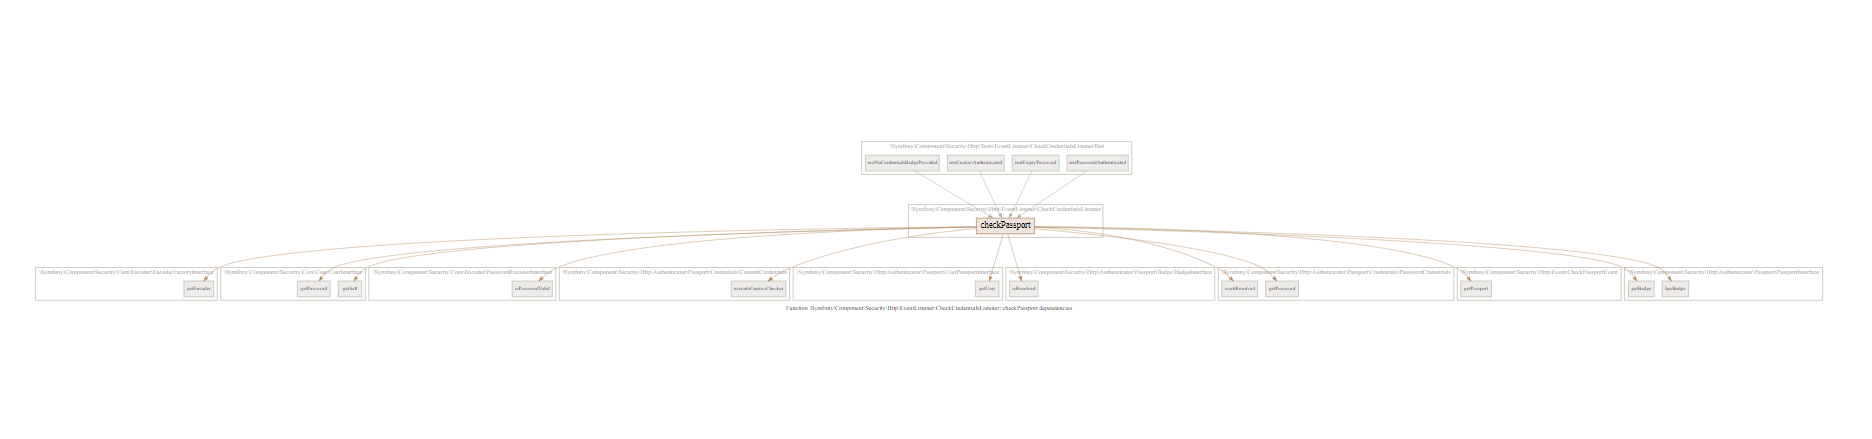
Contains the functions to be called as well as the fields used. For convenience, fields and methods are combined into named groups for each class.
To get the graph, use the graph func command.
The command takes one argument, the name of the function.
The command can also accept flags:
-o— name of the file to which the graph will be saved;--web— flag, when set, the graph will be displayed in the browser with the ability to move and scale the graph.
Example
For example, to create the graph above, the following command was used:
graph func -o graph.svg \Symfony\Component\Routing\Route::setDefaults
Links within a class (or graph for the LCOM 4 metric)
Example (svg): 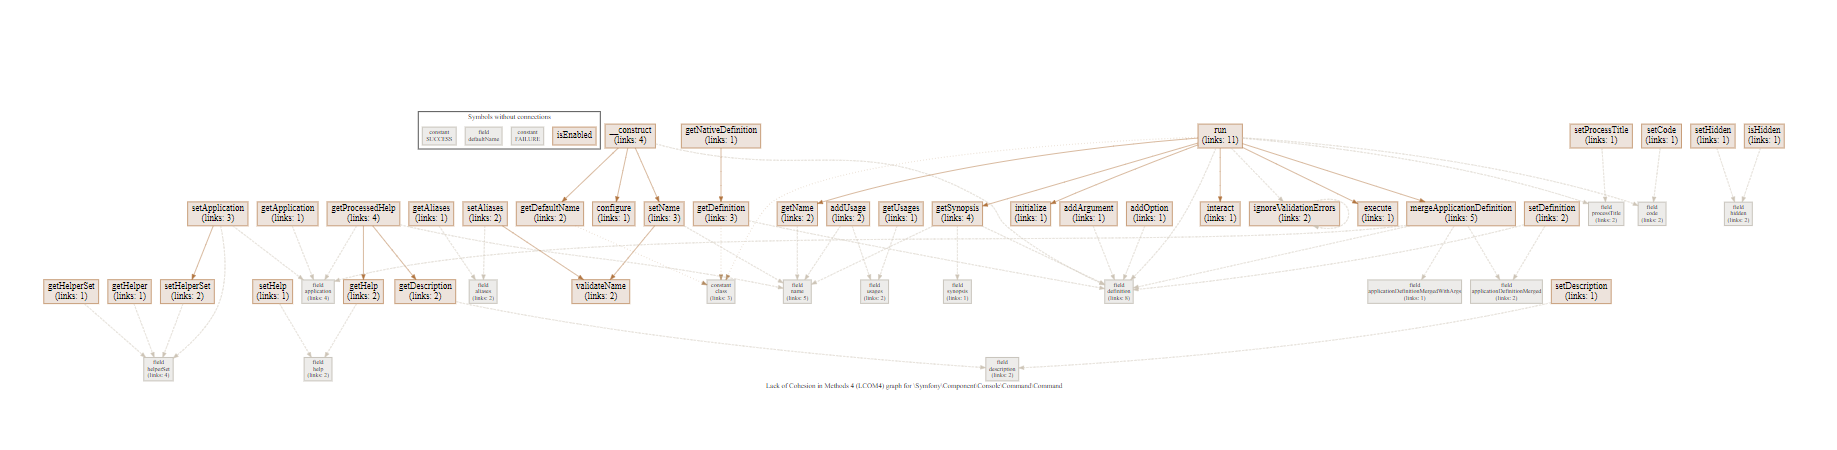
Contains links within the class. Elements that are not used anywhere are highlighted in a separate group.
To get the graph, use the command graph lcom4.
The command takes one argument, the name of the class.
The command can also accept flags:
-o— name of the file to which the graph will be saved;--web— flag, when set, the graph will be displayed in the browser with the ability to move and scale the graph.
Example
For example, to create the graph above, the following command was used:
graph lcom4 -o graph.svg \Symfony\Component\Console\Command\Command
Links between files
Example (svg):

Contains links between files, through inclusion in the global space and at the function level. Block connections are marked with dotted lines, global ones — with dashed.
To get a graph, use the graph file command.
The command takes one argument, the name of the file.
The command can also accept flags:
-o— name of the file to which the graph will be saved;-r— the level of nesting that is required (value 0 displays only the closest dependencies, 1 — also displays all the closest dependencies for the closest dependencies, and so on);--root— display in the graph links with files included in the global space;--block— display in the graph links with files included in functions;--web— flag, when set, the graph will be displayed in the browser with the ability to move and scale the graph.
If none of the flags (--root, --block) is specified, then by default all links will be displayed.
Example
For example, to create the graph above, the following command was used:
graph file -o graph.svg wp-load.php
Namespace dependencies graph
Example (svg):
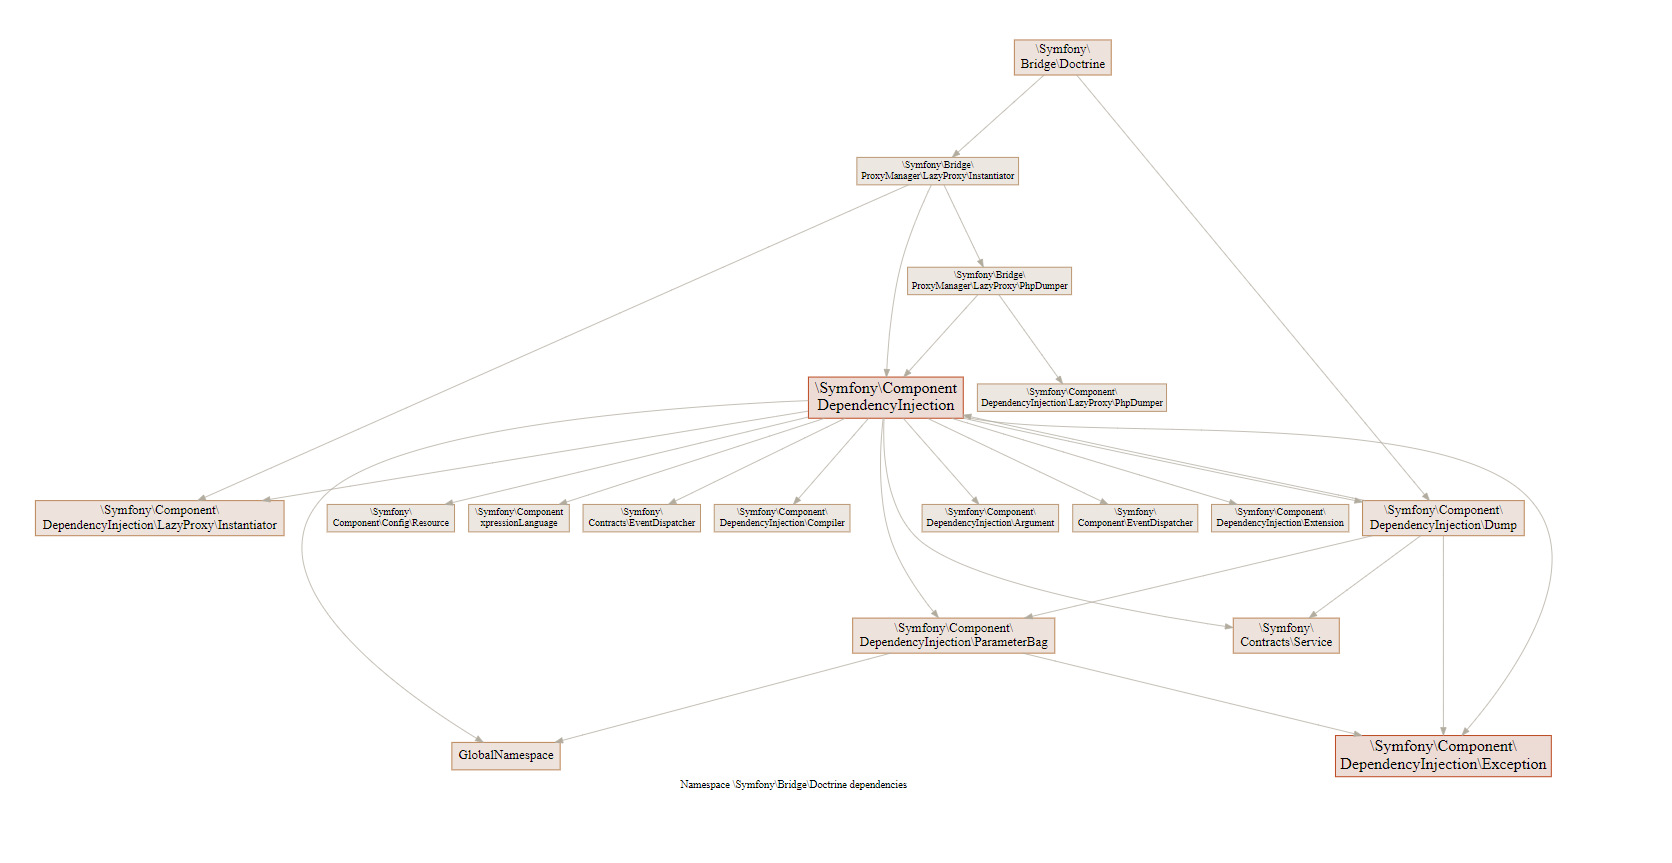
Contains links between namespaces.
To get a graph, use the graph namespace command.
The command takes one argument, the name of the namespace.
The command can also accept flags:
-o— name of the file to which the graph will be saved;-r— the level of nesting that is required (value 0 displays only the closest children, 1 — also displays all the closest children for the closest children, and so on);--web— flag, when set, the graph will be displayed in the browser with the ability to move and scale the graph.
Example
For example, to create the graph above, the following command was used:
graph namespace --web \Symfony\Bridge\Doctrine -r 2
Namespace structure graph
Example (svg):
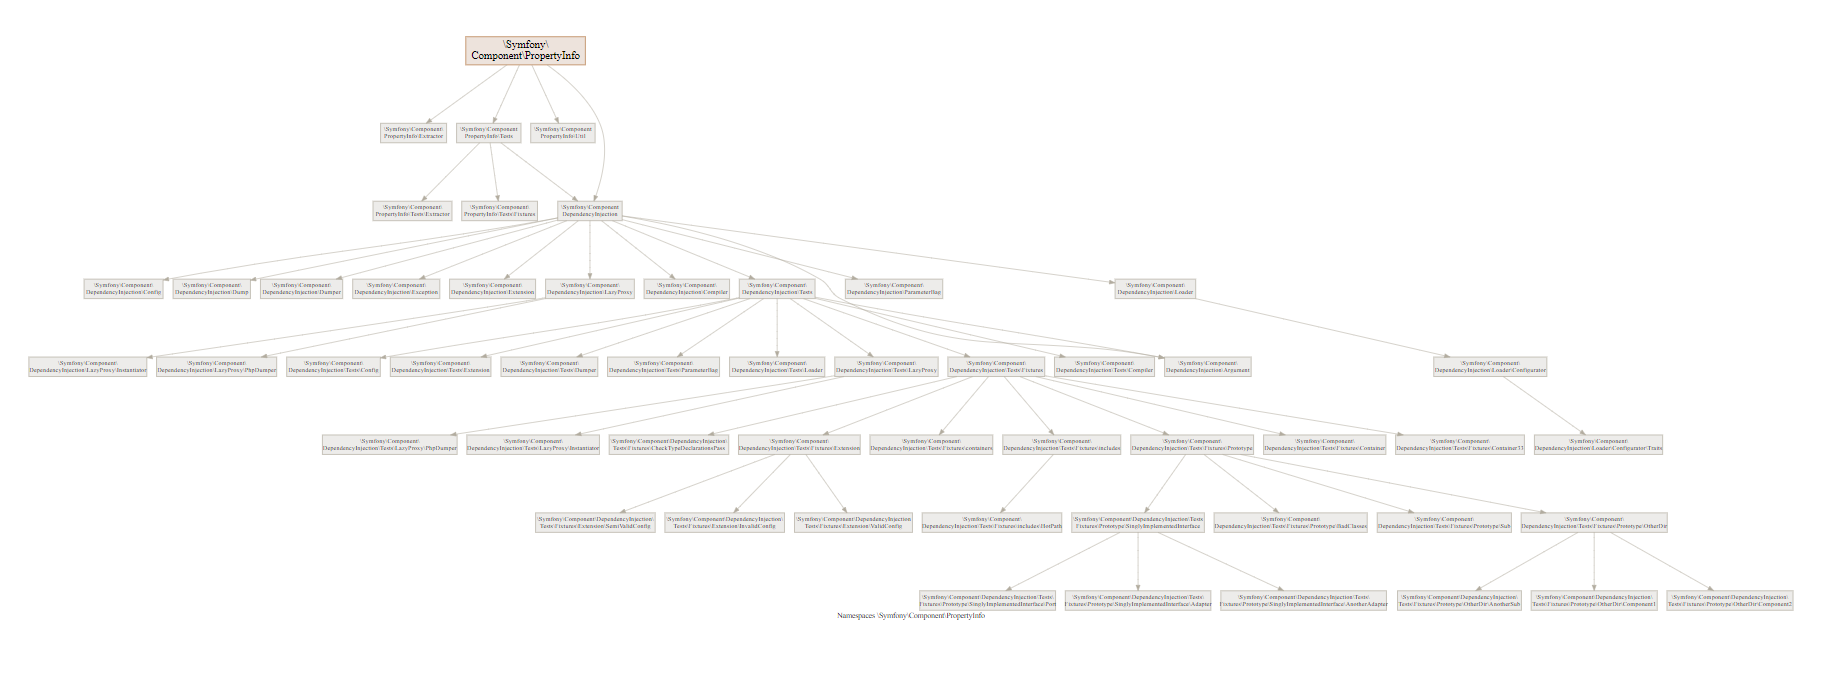
Contains the relationships between namespaces and their child namespaces.
To get a graph, use the graph namespace-structure command.
The command takes one argument, the name of the namespace.
The command can also accept flags:
-o— name of the file to which the graph will be saved;-r— the level of nesting that is required (value 0 displays only the closest children, 1 — also displays all the closest children for the closest children, and so on);--web— flag, when set, the graph will be displayed in the browser with the ability to move and scale the graph.
Example
For example, to create the graph above, the following command was used:
graph namespace-structure --web \Symfony\Component\PropertyInfo
Function reachability
Example (svg):
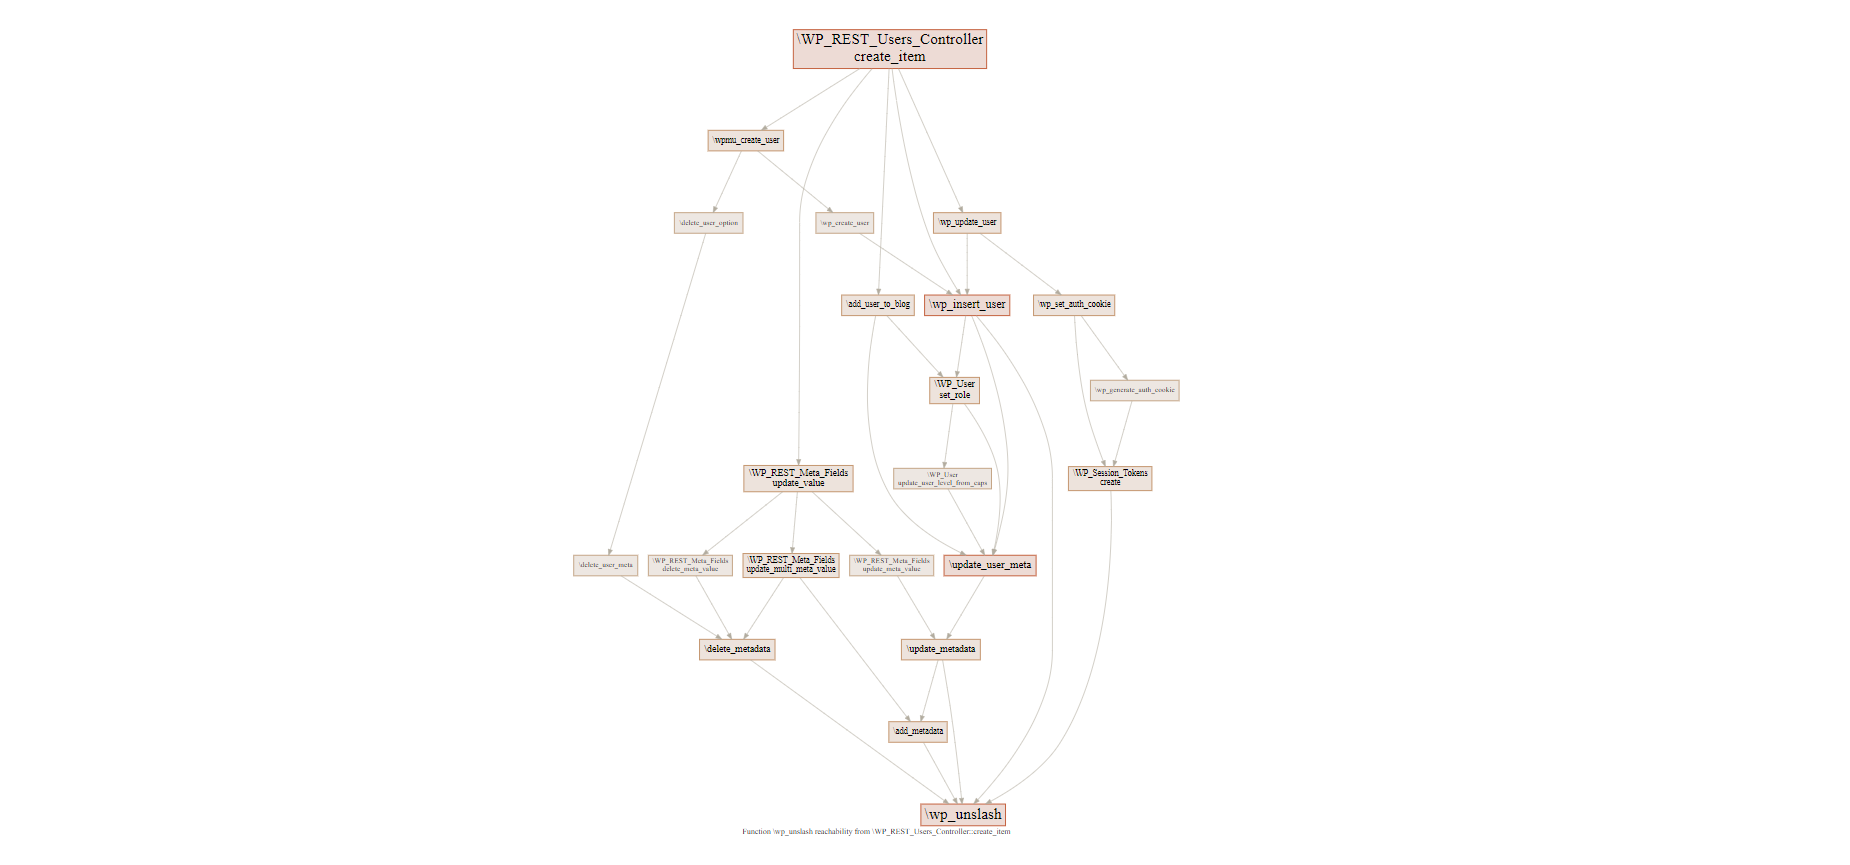
Contains all the ways in which function A can be reached from function B.
To get a graph, use the graph func-reachability command.
The command can also accept flags:
--parent— the name of the function from which the reachability will be checked;--child— function for which reachability will be checked;--depth— max search depth. Reachability will only be found if the function is called through no more than depth functions. Greater depth for large projects can lead to long run times;--exclude— a comma-separated list of functions without spaces to be excluded from found paths. Thus, if the path contains a function from this list, then this path will not be displayed;-o— name of the file to which the graph will be saved;-r— the level of nesting that is required (value 0 displays only the closest children, 1 — also displays all the closest children for the closest children, and so on);--web— flag, when set, the graph will be displayed in the browser with the ability to move and scale the graph.
Example
For example, to create the graph above, the following command was used:
graph func-reachability --web --parent \WP_REST_Users_Controller::create_item --child \wp_unslash --depth 10